In any fitting model the theory has parameters whose values we optimize to obtain the best fit. Depending upon the complexity of the model and the data, there are many strategies for varying the parameters to find their best values in the shortest time.
There are also several possible criteria for defining "best",
and we must choose one before we can even begin to fit.
Probably the most powerful methods involve
Bayesian inference,2
in which one asks different kinds of questions from
those one asks in more traditional methods
involving frequency-based probability theory,
which we will use in this course.3
Depending upon whether we have nonuniform "error bars" or not,
we should use either ![]() ("chi squared") minimization
(also known as "weighted least squares" fits)
or "unweighted least squares" fits.
The latter ignore uncertainties and merely seek to produce
the smallest possible sum of the squares of the differences
between experimental and theoretical values of the
dependent variable:
("chi squared") minimization
(also known as "weighted least squares" fits)
or "unweighted least squares" fits.
The latter ignore uncertainties and merely seek to produce
the smallest possible sum of the squares of the differences
between experimental and theoretical values of the
dependent variable:
Note that it is generally assumed that
only the dependent variable (generally "y")
has uncertainties, and furthermore that
those uncertainties are symmetric.
This is rarely the case, as I have emphasized;
I think people just give up too easily on "getting it right".
My Java applet muview will of course
handle asymmetric uncertainties, but none of the others
will do this without a lot of "data massaging".
To keep this Assignment from growing too complicated,
you can use muview on the original file
~phys210/HW/a04/data.db (recall Assignment 4)
but for the other applications
we will just ignore any uncertainties in xi
and "symmetrize" the uncertainties in yi
as shown in the file
~phys210/HW/a06/dbf.dat and below:
| 1 | -20 | -1.9 | 0.2 | |||
| 1 | -12 | -1.2 | 0.2 | |||
| 1 | -10 | -0.95 | 0.075 | |||
| 2 | -1 | -0.05 | 0.05 | |||
| 3 | 5 | 0.55 | 0.075 | |||
| 3 | 7.5 | 0.8 | 0.175 | |||
| 3 | 10.5 | 1.1 | 0.1 | |||
| 3 | 15 | 1.6 | 0.1 |
As usual, create your /home2/phys210/<you>/a06/ directory
and the subdirectories
muview/,
gnuplot/,
extrema/,
matlab/,
octave/ and
python/,
where you should store any files used to do the fitting,
along with the plotted results,
using the respective applications.
With each application,
learn how to fit the data in data.db or dbf.dat
and plot them along with the best fit line on a simple graph
in a plotfit.pdf file, stored
with the other files for that application, including
a plain text file ANSWER.txt giving
any comments plus the results of the fit
[a description of the theoretical function ![]() ,
the best-fit values of its parameters pj,
the uncertainties
,
the best-fit values of its parameters pj,
the uncertainties ![]() in the parameters pj
and the quality of the fit in
in the parameters pj
and the quality of the fit in ![]() per degree of freedom].
per degree of freedom].
In real life you will want to fit with much more sophisticated
functions ![]() , but here the emphasis is on procedure;
moreover, the data in data.db and dbf.dat
make a pretty straight line (as you may have noticed);
so just fit to a first-order polynomial
(i.e. a straight line),
, but here the emphasis is on procedure;
moreover, the data in data.db and dbf.dat
make a pretty straight line (as you may have noticed);
so just fit to a first-order polynomial
(i.e. a straight line),
![]() ,
using
,
using ![]() minimization.
minimization.
Now, in python you can probably find any number of
"canned" fitting packages just like those for the other applications;
but python is a full-blown programming language in its own right,
so we are going to tackle a real computational exercise in python,
namely a simple one-step numerical calculation of
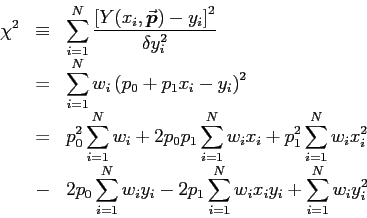
the best (minimum ![]() ) fit to a straight line:
) fit to a straight line:
Expand Eq. (2) in terms of Eq. (3):
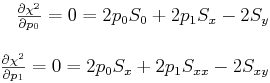
Our job is now to minimize that function with respect to p0 and p1
simultaneously. You know that a function has an extremum
(maximum or minimum) where its derivative is zero. In this case
we want both partial derivatives to be zero:
![]() and
and
![]() .
These requirements give two equations in two unknowns:
.
These requirements give two equations in two unknowns:
Don't forget to have your python program report the best fit and plot up the line through the points.
![\begin{displaymath}
\hbox{\rm Minimize ~ }
\sum_{i=1}^N \left[Y(x_i,\Vec{p}) - y_i\right]^2
\end{displaymath}](img2.gif)
![\begin{displaymath}
\hbox{\rm Minimize ~ } \chi^2 \equiv \sum_{i=1}^N
{\left[Y(x_i,\Vec{p}) - y_i\right]^2 \over \delta y_i^2}
\end{displaymath}](img5.gif)