

Next: Charge doped systems
Up: 5.2 Haldane material YBaNiO
Previous: 5.2.2 SR measurements
For the pure and vacancy-doped systems, the relaxation rate
( ) at
) at  K is temperature independent
(Fig.41); this is a characteristic of
paramagnetic relaxation. As shown in Fig.42a,b,
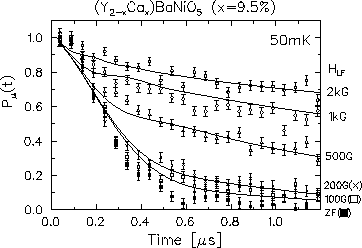
we also performed longitudinal field (LF) decoupling measurements in the
milli-Kelvin regime, and proved the dynamic nature of the
relaxation. The LF measurements confirm the absence of a static order in the
vacancy doped system.
Figure 42:
The LF- SR spectra of (a) the nominally
pure sample and (b) the Mg doped y=1.7% doped system. The solid lines are the
fit to the stretched exponential functions,
  with (a)
  and (b)
  . (c) The
relaxation rate (
 ) as a function of the longitudinal fields applied. The
solid lines are the analysis with the T1 relaxation theory
(Eq.33).
 |
As shown in Fig.42c, we have analyzed the LF
dependence of the relaxation rate  using the T1 formula
for dilute spin systems (eq.33). The resulting Lorentzian
field width (a) and field fluctuation rate (
 ) are shown in
Table 5. It was suggested that
vacancy-doping results in faster field fluctuations (
 ) and a
larger field width (a) than the nominally pure system shows.
Qualitatively, this result may be understood, if muons detect the
dipolar fields from unpaired spins in the sample: as susceptibility
has indicated, the number of unpaired spins increases upon doping.
Therefore, the doped system should exhibit a larger field-width (a)
at muon location, if the muons detect the dipolar fields from the
doping induced moments. If the interactions between these unpaired spins are
also dipolar interactions, the field fluctuation rate (
 ) should
increase upon doping, as has been observed in the Mg doped systems. A
more quantitative discussion, which leads to the estimates shown in
Table 5, is given later.
Table 5:
Results from the T1 relaxation analysis
| Sample |
Parameter |
Experiment |
Estimate |
| Pure |
 |
0.74(4) |
 |
| |
 (MHz) (MHz) |
72(12) |
 |
| Mg 1.7% |
 |
2.0(2) |
 |
| |
 (MHz) (MHz) |
600(100) |
 |
a see the discussion later.


Next: Charge doped systems
Up: 5.2 Haldane material YBaNiO
Previous: 5.2.2 SR measurements


![]() using the T1 formula
for dilute spin systems (eq.33). The resulting Lorentzian
field width (a) and field fluctuation rate (
using the T1 formula
for dilute spin systems (eq.33). The resulting Lorentzian
field width (a) and field fluctuation rate (![]() ) are shown in
Table 5. It was suggested that
vacancy-doping results in faster field fluctuations (
) are shown in
Table 5. It was suggested that
vacancy-doping results in faster field fluctuations (![]() ) and a
larger field width (a) than the nominally pure system shows.
Qualitatively, this result may be understood, if muons detect the
dipolar fields from unpaired spins in the sample: as susceptibility
has indicated, the number of unpaired spins increases upon doping.
Therefore, the doped system should exhibit a larger field-width (a)
at muon location, if the muons detect the dipolar fields from the
doping induced moments. If the interactions between these unpaired spins are
also dipolar interactions, the field fluctuation rate (
) and a
larger field width (a) than the nominally pure system shows.
Qualitatively, this result may be understood, if muons detect the
dipolar fields from unpaired spins in the sample: as susceptibility
has indicated, the number of unpaired spins increases upon doping.
Therefore, the doped system should exhibit a larger field-width (a)
at muon location, if the muons detect the dipolar fields from the
doping induced moments. If the interactions between these unpaired spins are
also dipolar interactions, the field fluctuation rate (![]() ) should
increase upon doping, as has been observed in the Mg doped systems. A
more quantitative discussion, which leads to the estimates shown in
Table 5, is given later.
) should
increase upon doping, as has been observed in the Mg doped systems. A
more quantitative discussion, which leads to the estimates shown in
Table 5, is given later.
![]()
![]()
![]()
![]() (MHz)
(MHz)![]()
![]()

![]() (MHz)
(MHz)![]()