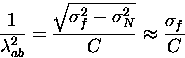
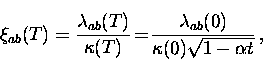
In this chapter, recent ![]() SR measurements of the
SR measurements of the
![]() -
-![]() plane magnetic penetration depth
plane magnetic penetration depth ![]() and the vortex core size (
and the vortex core size (![]() )
in the high-Tc compound YBa2Cu3O6.95
are presented. The oxygen concentration in this superconductor
is that which gives the maximum value of the transition temperature
Tc.
)
in the high-Tc compound YBa2Cu3O6.95
are presented. The oxygen concentration in this superconductor
is that which gives the maximum value of the transition temperature
Tc.
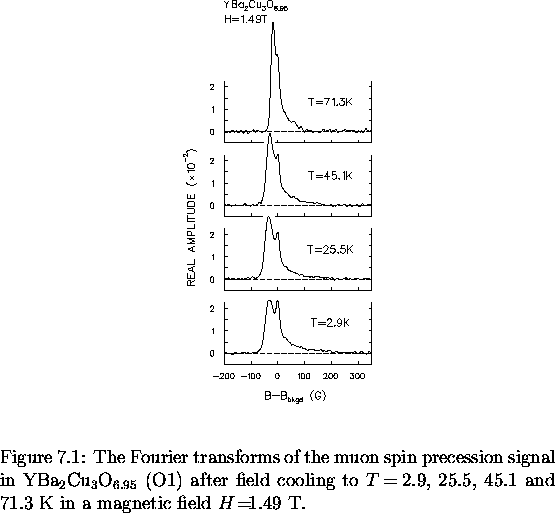
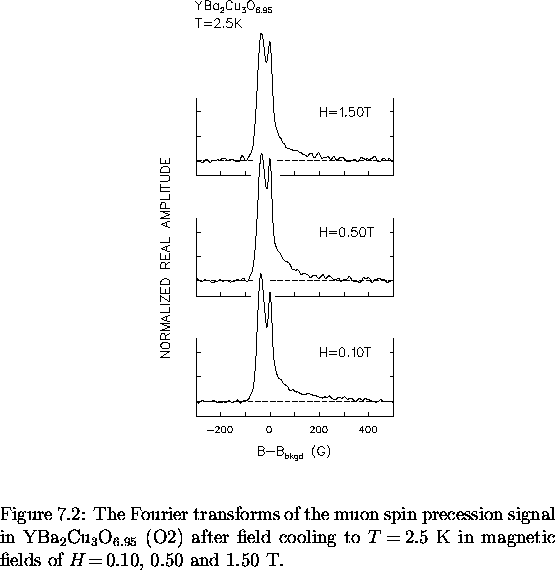
Figures 7.1 and 7.2 show the Fourier transforms of the muon precession signal in the optimally doped compound YBa2Cu3O6.95 as a function of temperature and magnetic field, respectively. In Figure 7.2 it was necessary to renormalize the Fourier amplitudes to the same maximum height, because of a reduction in the signal amplitude with increasing magnetic field. Asymmetry loss is due to the finite timing resolution of the counters, a reduction in the radii of the decay positron orbits and a dephasing of the muon beam before it reaches the sample. The last originates from muons with slightly different momenta and/or beam trajectories, which take different times to traverse the magnetic field and therefore precess different amounts prior to arrival at the sample.
The basic features expected for a rigid 3D vortex lattice are observed
in these Fourier transforms, although their signal-to-noise
ratio ![[*]](foot_motif.gif) is
not as good as those for NbSe2.
In addition, the high-field cutoff is not clearly visible at low temperatures,
which is partly a result of the much smaller
coherence length (and vortex-core radius) in this material.
The smaller value of r0 means that fewer muons stop in the vicinity
of the vortex cores, resulting in less signal-to-noise in the high-field tail.
Consequently,
is
not as good as those for NbSe2.
In addition, the high-field cutoff is not clearly visible at low temperatures,
which is partly a result of the much smaller
coherence length (and vortex-core radius) in this material.
The smaller value of r0 means that fewer muons stop in the vicinity
of the vortex cores, resulting in less signal-to-noise in the high-field tail.
Consequently, ![]() and r0 are difficult to determine
in this material so deep in the superconducting state.
Since the signal-to-noise ratio scales with
and r0 are difficult to determine
in this material so deep in the superconducting state.
Since the signal-to-noise ratio scales with ![]() , where N is the
number of counts, it takes an impractical amount of time to make significant
improvements in the high-field tail of the measured field distribution.
To dramatically improve the signal-to-noise ratio in the high-field tail, it is
necessary to go to higher magnetic fields where there are more vortices
in the sample. According to the spectra presented in Ref. [50],
at low temperatures this means magnetic fields in excess of at least 5 T.
Unfortunately, as just mentioned, there are problems
associated with the signal amplitude at such large H. Currently,
efforts are underway to construct an apparatus which operates effectively
in such strong magnetic fields. This ``high-field'' apparatus will include the
use of higher timing resolution counters and a reduction in the
distance between the decay positron counters and the sample.
A high-field cutoff is clearly visible at high
temperatures, as shown in Fig. 7.1. This is because r0
increases with T as was just observed in the case of NbSe2.
, where N is the
number of counts, it takes an impractical amount of time to make significant
improvements in the high-field tail of the measured field distribution.
To dramatically improve the signal-to-noise ratio in the high-field tail, it is
necessary to go to higher magnetic fields where there are more vortices
in the sample. According to the spectra presented in Ref. [50],
at low temperatures this means magnetic fields in excess of at least 5 T.
Unfortunately, as just mentioned, there are problems
associated with the signal amplitude at such large H. Currently,
efforts are underway to construct an apparatus which operates effectively
in such strong magnetic fields. This ``high-field'' apparatus will include the
use of higher timing resolution counters and a reduction in the
distance between the decay positron counters and the sample.
A high-field cutoff is clearly visible at high
temperatures, as shown in Fig. 7.1. This is because r0
increases with T as was just observed in the case of NbSe2.
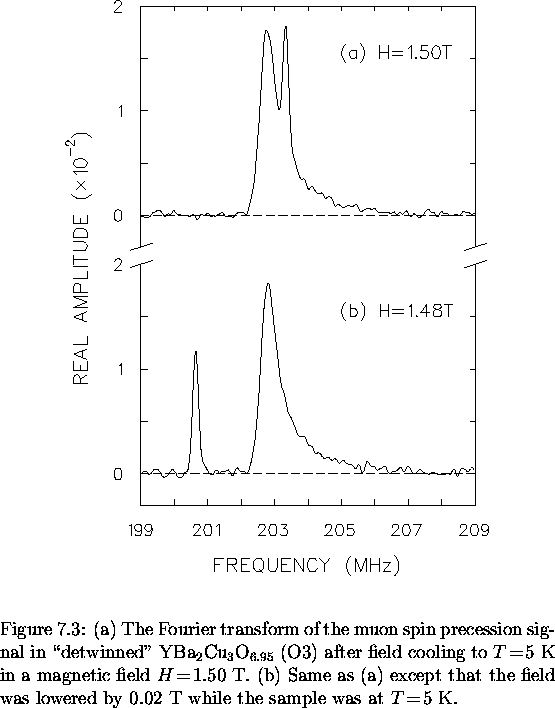
As noted earlier, oxygen vacancies and twin planes may pin
vortices in YBa2Cu3O![]() . The strength of this pinning
can be studied by determiming the sensitivity of the
. The strength of this pinning
can be studied by determiming the sensitivity of the ![]() SR spectrum
to small changes in magnetic field. Figure 7.3(a) shows the
Fourier transform of the muon spin precession signal in
``detwinned'' YBa2Cu3O6.95 (O3) after field cooling to
SR spectrum
to small changes in magnetic field. Figure 7.3(a) shows the
Fourier transform of the muon spin precession signal in
``detwinned'' YBa2Cu3O6.95 (O3) after field cooling to
![]() K in a magnetic field of
K in a magnetic field of ![]() T. When the
applied field is decreased by 0.02 T, the residual background signal
shifts down to the new applied field
T. When the
applied field is decreased by 0.02 T, the residual background signal
shifts down to the new applied field
![]() T [see Fig. 7.3(b)]. However, the signal
originating from the sample
does not shift in response to the small change in applied field.
This shows that the vortex lattice is firmly pinned.
In addition, the
absence of any detectable background peak in the unshifted signal
implies that there are no nonsuperconducting inclusions in the sample.
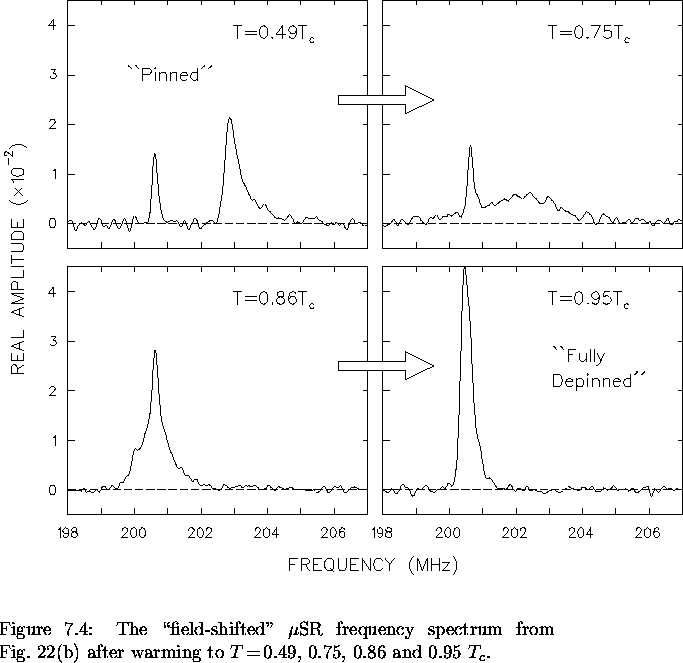
As the temperature is increased, the shape of the Fourier transform
changes due to the changes in
T [see Fig. 7.3(b)]. However, the signal
originating from the sample
does not shift in response to the small change in applied field.
This shows that the vortex lattice is firmly pinned.
In addition, the
absence of any detectable background peak in the unshifted signal
implies that there are no nonsuperconducting inclusions in the sample.
As the temperature is increased, the shape of the Fourier transform
changes due to the changes in ![]() and
and ![]() . However,
the signal remains unshifted indicating that the vortices are still
pinned. Eventually, the temperature is large
enough that thermal fluctutations depin some of the 3D vortex lines,
as shown in Fig. 7.4.
Raising the temperature even further results in thermal depinning of
the remaining fixed vortex lines. On the other hand,
the vortex lattice is not so strongly pinned in NbSe2. When
the applied magnetic field on NbSe2 was shifted by a small amount
at low temperatures,
the sample signal always shifted with the background signal.
. However,
the signal remains unshifted indicating that the vortices are still
pinned. Eventually, the temperature is large
enough that thermal fluctutations depin some of the 3D vortex lines,
as shown in Fig. 7.4.
Raising the temperature even further results in thermal depinning of
the remaining fixed vortex lines. On the other hand,
the vortex lattice is not so strongly pinned in NbSe2. When
the applied magnetic field on NbSe2 was shifted by a small amount
at low temperatures,
the sample signal always shifted with the background signal.
The muon precession signals for YBa2Cu3O6.95 were fit in a manner similar to that for NbSe2, with the following additional constraints and assumptions:
 |
(1) |
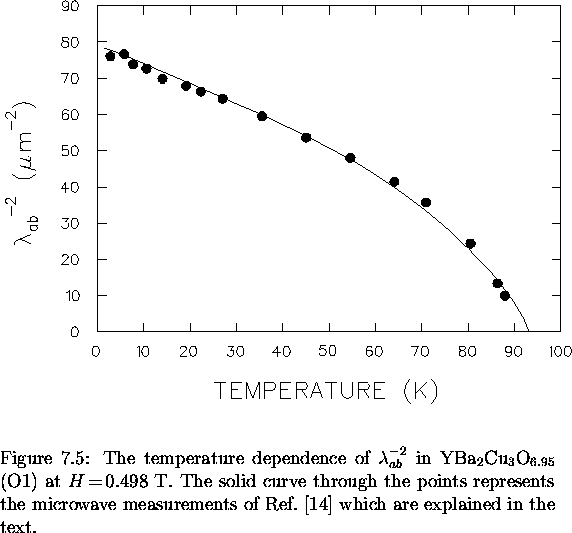
Figure 7.5 shows the temperature dependence of ![]() in YBa2Cu3O6.95 (O1) at
in YBa2Cu3O6.95 (O1) at ![]() T, from fits assuming
the analytical GL model [see Eq. (4.13)].
The linear temperature dependence at low T supports an unconventional
pairing state in which there are nodes in the superconducting energy gap.
The solid curve in Fig. 7.5 represents
the zero-field microwave measurements
of
T, from fits assuming
the analytical GL model [see Eq. (4.13)].
The linear temperature dependence at low T supports an unconventional
pairing state in which there are nodes in the superconducting energy gap.
The solid curve in Fig. 7.5 represents
the zero-field microwave measurements
of ![]() K)
performed by Hardy et al. [14] on similar
high quality YBa2Cu3O6.95 crystals.
To plot
K)
performed by Hardy et al. [14] on similar
high quality YBa2Cu3O6.95 crystals.
To plot ![]() for the microwave data, our extrapolated value
of
for the microwave data, our extrapolated value
of ![]() K) was used. The excellent agreement between
the measurements in the vortex state and those in the Meissner state
indicate that the variation of the superfluid fraction as a function
of temperature is identical in
both phases. Furthermore, this confirms that the assumption of a triangular
vortex lattice in the fitting procedure introduces at most only a
small systematic error in the absolute value of
K) was used. The excellent agreement between
the measurements in the vortex state and those in the Meissner state
indicate that the variation of the superfluid fraction as a function
of temperature is identical in
both phases. Furthermore, this confirms that the assumption of a triangular
vortex lattice in the fitting procedure introduces at most only a
small systematic error in the absolute value of ![]() .
This is reasonable since it has been shown theoretically that including
additional terms in the free energy of the vortex state produces only
minor changes in the internal field distribution [178].
This can be confirmed by fitting the data to a theoretical
field profile which assumes an inappropriate vortex-lattice
configuration. For instance, if a square vortex lattice is assumed
in the fitting procedure, the quality of the fits is found to be
much worse and the absolute value of
.
This is reasonable since it has been shown theoretically that including
additional terms in the free energy of the vortex state produces only
minor changes in the internal field distribution [178].
This can be confirmed by fitting the data to a theoretical
field profile which assumes an inappropriate vortex-lattice
configuration. For instance, if a square vortex lattice is assumed
in the fitting procedure, the quality of the fits is found to be
much worse and the absolute value of ![]() does change
dramatically. However, the temperature dependence of
does change
dramatically. However, the temperature dependence of
![]() from these fits is nearly identical to that obtained assuming
a triangular vortex lattice.
from these fits is nearly identical to that obtained assuming
a triangular vortex lattice.
Our ![]() SR measurements of
SR measurements of ![]() presented
in Ref. [2]
suggest that the strength of the term linear in T depends on magnetic
field. However, as noted in Ref. [3], this effect is
artificially created by prematurely cutting off the summation over
reciprocal lattice vectors. The problem is easily rectified by increasing
the sum until any further increase does not affect the deduced value of
presented
in Ref. [2]
suggest that the strength of the term linear in T depends on magnetic
field. However, as noted in Ref. [3], this effect is
artificially created by prematurely cutting off the summation over
reciprocal lattice vectors. The problem is easily rectified by increasing
the sum until any further increase does not affect the deduced value of
![]() . Although the term linear in T is found to be
H-independent here,
the absolute value of
. Although the term linear in T is found to be
H-independent here,
the absolute value of ![]() does depend
strongly on magnetic field.
In Ref. [3],
does depend
strongly on magnetic field.
In Ref. [3], ![]() was measured in the
vortex state of YBa2Cu3O6.95 (O1, O2) as a function
of magnetic field. The internal field distribution was fit assuming
the ML model with a Gaussian cutoff factor. The results of this study
are listed in Table 7.4. Yaouanc et al. [121]
suggest that the observed field dependence is probably explained
if a more appropriate cutoff function is used.
Using the conventional GL equations,
they have shown that the variance of the field distribution
was measured in the
vortex state of YBa2Cu3O6.95 (O1, O2) as a function
of magnetic field. The internal field distribution was fit assuming
the ML model with a Gaussian cutoff factor. The results of this study
are listed in Table 7.4. Yaouanc et al. [121]
suggest that the observed field dependence is probably explained
if a more appropriate cutoff function is used.
Using the conventional GL equations,
they have shown that the variance of the field distribution
![]() depends on magnetic field. Through
rough calculations of the variance from
our measurements in Ref. [2], they find good agreement with
the field dependence predicted by the conventional GL theory.
Unfortunately, as noted above, the results in Ref. [2]
are flawed. The field dependence for
depends on magnetic field. Through
rough calculations of the variance from
our measurements in Ref. [2], they find good agreement with
the field dependence predicted by the conventional GL theory.
Unfortunately, as noted above, the results in Ref. [2]
are flawed. The field dependence for ![]() has since been
shown to
be much stronger [3]. It is unlikely that this field
dependence is related to an improper treatment of the vortex cores,
since the small cores in YBa2Cu3O6.95 contribute very little
to the variance at low fields.
Nevertheless, to properly account
for the finite size of the vortex cores, the data has been re-analyzed
here using the analytical GL model as suggested by
the authors of Ref. [121].
has since been
shown to
be much stronger [3]. It is unlikely that this field
dependence is related to an improper treatment of the vortex cores,
since the small cores in YBa2Cu3O6.95 contribute very little
to the variance at low fields.
Nevertheless, to properly account
for the finite size of the vortex cores, the data has been re-analyzed
here using the analytical GL model as suggested by
the authors of Ref. [121].
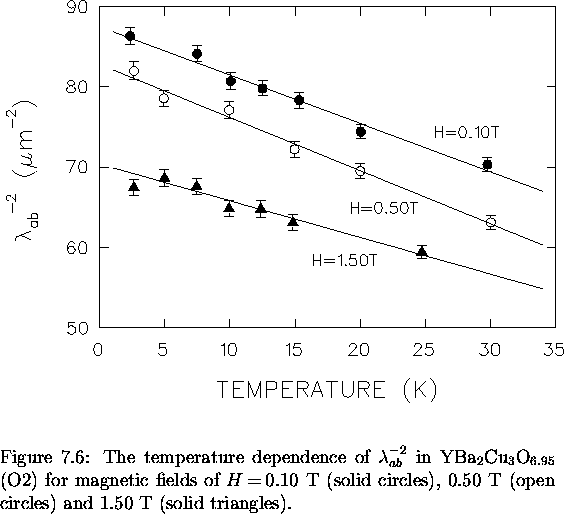
Figure 7.6 shows the low temperature
behaviour of ![]() in YBa2Cu3O6.95 (O2) obtained from this new analysis
for three of the magnetic fields considered. As in Ref. [3],
excellent fits are obtained to a linear relation
in YBa2Cu3O6.95 (O2) obtained from this new analysis
for three of the magnetic fields considered. As in Ref. [3],
excellent fits are obtained to a linear relation
| |
(2) |
| 2c| |
2c| |
|||||
| Magnetic | Beamline/Year | |||||
| Field | C | |||||
| [T] | [106 Å |
[Å] | [10-1] | [Å] | [10-1] | |
| 1|l|(i) | ||||||
|---|---|---|---|---|---|---|
| 0.191 | m20/1993 | 1.955 | 1188(8) | 6.0(3) | 1115(7) | 4.8(4) |
| 0.192 | m15/1993 | 1.943 | 1181(7) | 6.5(6) | 1114(6) | 6.2(2) |
| 0.498 | m15/1992 | 1.835 | 1208(13) | 6.6(3) | 1129(12) | 6.3(2) |
| 0.731 | m15/1994 | 1.827 | 1222(20) | 6.3(5) | 1165(18) | 6.3(4) |
| 1.003 | m15/1993 | 1.625 | 1228(16) | 6.3(4) | 1168(12) | 6.0(4) |
| 1.488 | m15/1992 | 1.784 | 1272(7) | 5.8(4) | 1195(6) | 5.9(4) |
| 1.952 | m15/1993 | 2.275 | 1351(37) | 7.3(7) | 1261(34) | 5.5(8) |
| 1|l|(ii) | ||||||
| 0.103 | m20/1995 | 1.195 | 1149(6) | 6.2(2) | 1069(6) | 6.4(4) |
| 0.497 | m20/1995 | 1.485 | 1171(9) | 7.5(4) | 1099(9) | 7.5(3) |
| 1.500 | m20/1995 | 1.833 | 1277(14) | 6.6(6) | 1192(12) | 6.1(7) |
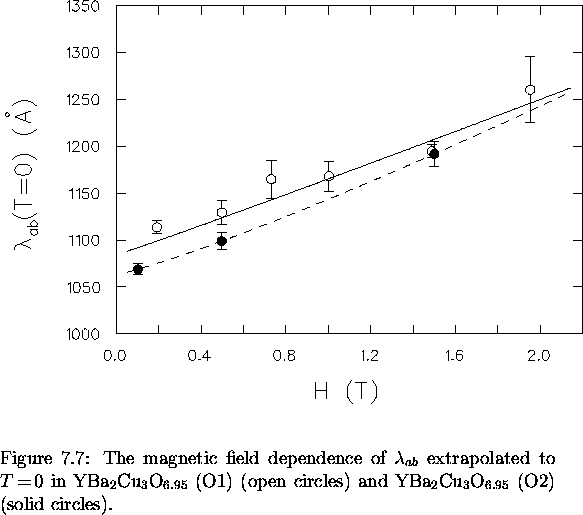
Figure 7.7 shows the magnetic field dependence of
![]() extrapolated to
extrapolated to ![]() for sample O1 (open circles)
and sample O2 (solid circles).
The solid and dashed curves are fits to the power-law relation
for sample O1 (open circles)
and sample O2 (solid circles).
The solid and dashed curves are fits to the power-law relation
| |
(3) |
that
| 3|c| |
3c| |
||||
| p | p | ||||
| [Å] | [Å/T] | [Å] | [Å/T] | ||
| 1|l|(i) | |||||
|---|---|---|---|---|---|
| 1181(4) | 52(4) | 1.5(1) | 1084(3) | 81(1) | 1.0(1) |
| 1|l|(ii) | |||||
| 1147(5) | 71(8) | 1.5(2) | 1063(2) | 80(3) | 1.16(12) |
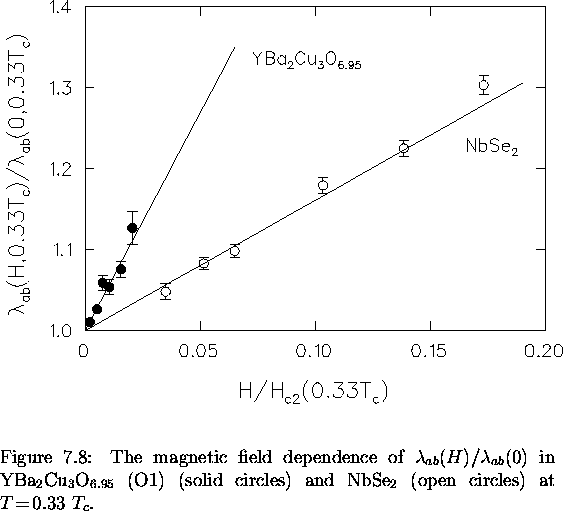
The strong field dependence for ![]() in YBa2Cu3O6.95 is obtained from
both types of analysis, and is considerably stronger than
that found in NbSe2. Figure 7.8 shows the field dependence
of
in YBa2Cu3O6.95 is obtained from
both types of analysis, and is considerably stronger than
that found in NbSe2. Figure 7.8 shows the field dependence
of ![]() at
at ![]() for both of these materials.
The solid lines are a fit to the equation
for both of these materials.
The solid lines are a fit to the equation
![\begin{displaymath}
\frac{\lambda_{ab} (H)}{\lambda_{ab} (0)}
= 1+ \varepsilon \left[ \frac{H}{H_{c2} (0.33~T_c)} \right] \, ,\end{displaymath}](img558.gif) |
(4) |
Figure 7.9 shows the temperature dependence of the linear coefficient
![]() determined from Eq. (2.50) for
YBa2Cu3O6.95 (O1). The large error bars are due to the
scatter and to temperature variations between the different data sets.
The scatter in the data at each temperature was too large to deduce
the precise field dependence, so a linear dependence on H was assumed.
The finite value of
determined from Eq. (2.50) for
YBa2Cu3O6.95 (O1). The large error bars are due to the
scatter and to temperature variations between the different data sets.
The scatter in the data at each temperature was too large to deduce
the precise field dependence, so a linear dependence on H was assumed.
The finite value of ![]() at
at ![]() is consistent with the field-induced pair breaking effects expected in a
superconductor with nodes in the energy gap.
We note that
is consistent with the field-induced pair breaking effects expected in a
superconductor with nodes in the energy gap.
We note that ![]() is approximately
30 times smaller at low T and about 10 times smaller at
is approximately
30 times smaller at low T and about 10 times smaller at
![]() than the values reported by Maeda et al.
[38] for microwave cavity perturbation measurements
in the Meissner state of YBa2Cu3O
than the values reported by Maeda et al.
[38] for microwave cavity perturbation measurements
in the Meissner state of YBa2Cu3O![]() .
However, very recently
Bidinosti et al. [208] have determined
the field dependence of
.
However, very recently
Bidinosti et al. [208] have determined
the field dependence of ![]() in
YBa2Cu3O6.95 in the Meissner state from AC susceptibility
measurements. They find that the
coefficient of the term linear in H is
approximately an order of magnitude smaller
than that reported by Maeda et al.
Nevertheless, the different definition of the penetration
depth in the
in
YBa2Cu3O6.95 in the Meissner state from AC susceptibility
measurements. They find that the
coefficient of the term linear in H is
approximately an order of magnitude smaller
than that reported by Maeda et al.
Nevertheless, the different definition of the penetration
depth in the ![]() SR experiment (which was discussed earlier) makes
a comparison to these Meissner state experiments very difficult.
SR experiment (which was discussed earlier) makes
a comparison to these Meissner state experiments very difficult.
It is possible that some of the measured field dependence for
![]() is due to changes in the vortex-lattice geometry
with increasing magnetic field--which is predicted in a number
of theoretical studies [178,179,180].
It is currently unknown if such geometry changes actually occur.
However, if they do, the question is whether these
changes are subtle over the narrow field range considered here.
We now show that the fits to the data suggest that there
are no significant changes in the vortex-lattice geometry.
This does not necessarily imply that the theories are wrong,
since the strong pinning of the vortex lines in the
YBa2Cu3O6.95 samples studied here likely prevents
such geometrical changes from occurring.
is due to changes in the vortex-lattice geometry
with increasing magnetic field--which is predicted in a number
of theoretical studies [178,179,180].
It is currently unknown if such geometry changes actually occur.
However, if they do, the question is whether these
changes are subtle over the narrow field range considered here.
We now show that the fits to the data suggest that there
are no significant changes in the vortex-lattice geometry.
This does not necessarily imply that the theories are wrong,
since the strong pinning of the vortex lines in the
YBa2Cu3O6.95 samples studied here likely prevents
such geometrical changes from occurring.
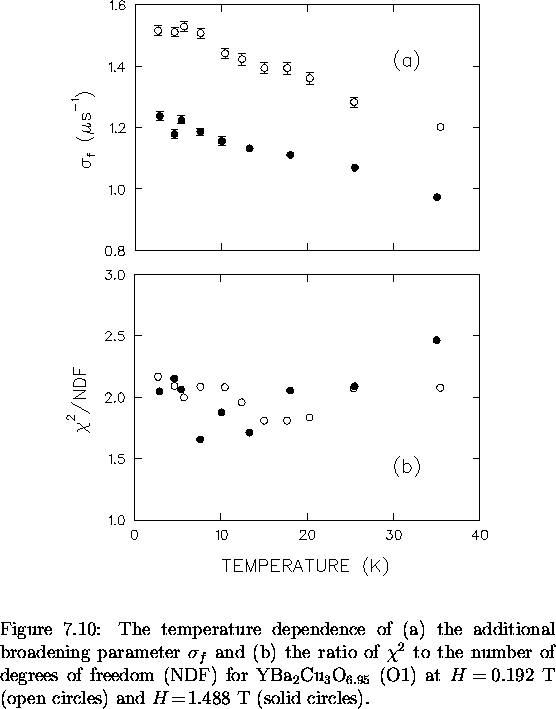
Figure 7.10(a) shows the temperature dependence of the additional
broadening parameter ![]() in
YBa2Cu3O6.95 (O1) at
in
YBa2Cu3O6.95 (O1) at ![]() T (open circles)
and
T (open circles)
and ![]() T (solid circles). Due to the imposed
constraint of Eq. (7.1),
T (solid circles). Due to the imposed
constraint of Eq. (7.1), ![]() exhibits the
same linear dependence on T as
exhibits the
same linear dependence on T as ![]() . Despite this
constraint, we find that
. Despite this
constraint, we find that ![]() T
T![]() T),
while
T),
while ![]() T
T![]() T)--which
implies that the line width of the measured internal field distribution
is definitely larger at smaller fields.
T)--which
implies that the line width of the measured internal field distribution
is definitely larger at smaller fields.
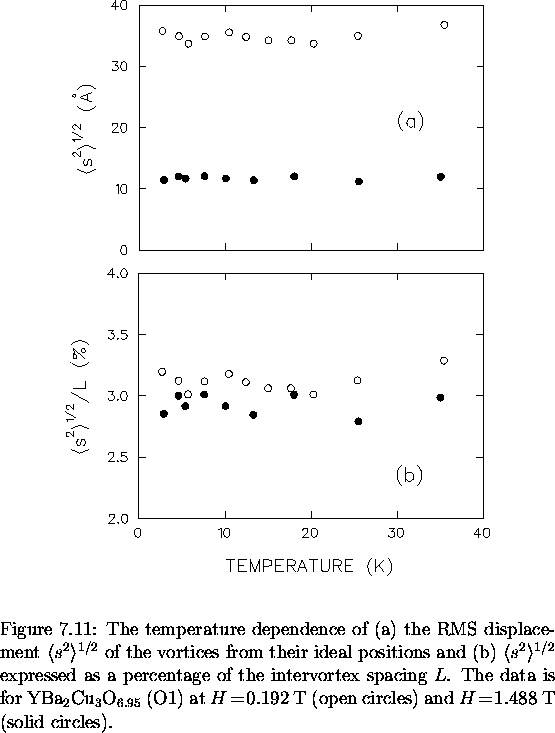
The RMS displacement
![]() of the vortex
lines from their ideal positions in a perfect triangular lattice
[determined from Eq. (6.3)], is plotted as a
function of temperature in Fig. 7.11(a)
.
The value of
of the vortex
lines from their ideal positions in a perfect triangular lattice
[determined from Eq. (6.3)], is plotted as a
function of temperature in Fig. 7.11(a)
.
The value of ![]() is much larger at
is much larger at ![]() T than at
T than at ![]() T.
This is most likely due to an enhancement in the random
pinning of vortex lines by point defects at the smaller magnetic
field.
Figure 7.11(b) shows
T.
This is most likely due to an enhancement in the random
pinning of vortex lines by point defects at the smaller magnetic
field.
Figure 7.11(b) shows ![]() as a percentage of L
in YBa2Cu3O6.95 (O1). The close agreement at the two different
magnetic fields suggests that at low temperatures, where thermal fluctuations
are small, the disorder in the vortex lattice scales with the nearest-neighbor
distance between vortex lines, as was found in NbSe2. This result
is inconsistent with a dramatic change in the vortex-lattice geometry
in going from
as a percentage of L
in YBa2Cu3O6.95 (O1). The close agreement at the two different
magnetic fields suggests that at low temperatures, where thermal fluctuations
are small, the disorder in the vortex lattice scales with the nearest-neighbor
distance between vortex lines, as was found in NbSe2. This result
is inconsistent with a dramatic change in the vortex-lattice geometry
in going from ![]() T to
T to ![]() T at low T.
Further evidence that there are no significant distortions in the
vortex lattice over this narrow field range is given by the
consistency in the quality of the fits assuming a triangular vortex
lattice. Figure 7.10(b) shows that
T at low T.
Further evidence that there are no significant distortions in the
vortex lattice over this narrow field range is given by the
consistency in the quality of the fits assuming a triangular vortex
lattice. Figure 7.10(b) shows that
![]() normalized to the number of degrees of freedom
is essentially independent of magnetic field and temperature
in the region of the phase diagram considered in this experiment.
Certainly this would not be the case if there were a sharp transition
e.g. from a triangular to a fourfold-symmetric vortex lattice.
normalized to the number of degrees of freedom
is essentially independent of magnetic field and temperature
in the region of the phase diagram considered in this experiment.
Certainly this would not be the case if there were a sharp transition
e.g. from a triangular to a fourfold-symmetric vortex lattice.
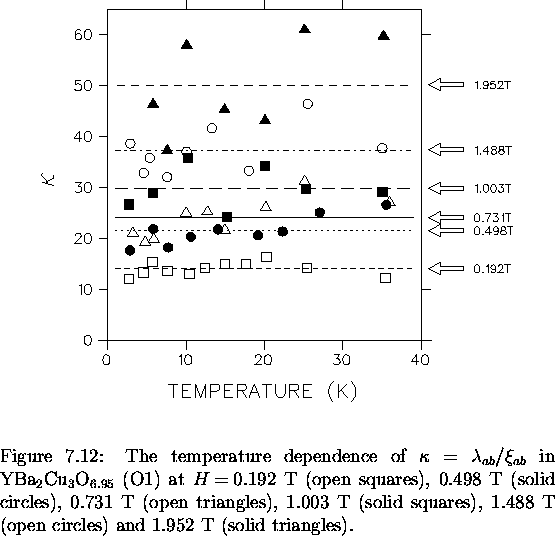
Figure 7.12 shows the temperature dependence of ![]() in
YBa2Cu3O6.95 (O1) at the different magnetic fields considered.
The scatter in the data reflects the uncertainty which arises
in fitting a field distribution which has a small signal-to-noise ratio in the
high-field tail. Surprisingly, there is less scatter in the
data at the lower fields where there are fewer vortices in the sample.
This suggests that the vortex-core radius must be significantly larger
at smaller H, as was the case in NbSe2. The data in Fig. 7.12
suggests that
in
YBa2Cu3O6.95 (O1) at the different magnetic fields considered.
The scatter in the data reflects the uncertainty which arises
in fitting a field distribution which has a small signal-to-noise ratio in the
high-field tail. Surprisingly, there is less scatter in the
data at the lower fields where there are fewer vortices in the sample.
This suggests that the vortex-core radius must be significantly larger
at smaller H, as was the case in NbSe2. The data in Fig. 7.12
suggests that ![]() is either independent of temperature or
increases very weakly with increasing T. However,
is either independent of temperature or
increases very weakly with increasing T. However, ![]() depends strongly on magnetic field in YBa2Cu3O6.95.
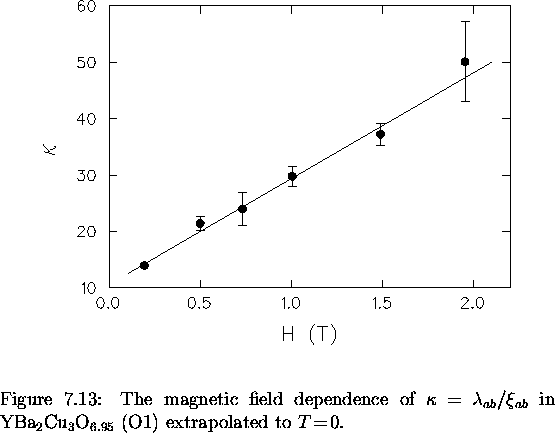
Figure 7.13 shows the best fits to the data sets at the different
magnetic fields in Fig. 7.12,
assuming a T-independent value of
depends strongly on magnetic field in YBa2Cu3O6.95.
Figure 7.13 shows the best fits to the data sets at the different
magnetic fields in Fig. 7.12,
assuming a T-independent value of ![]() .The solid line in Fig. 7.13 is a fit to the linear relation
.The solid line in Fig. 7.13 is a fit to the linear relation
| |
(5) |
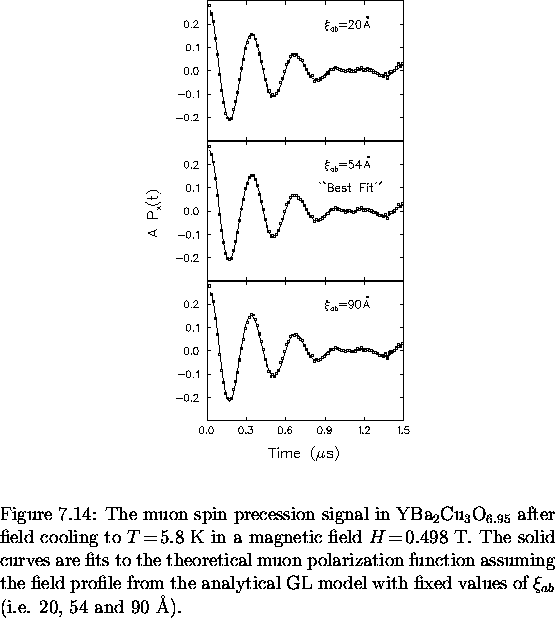
Figure 7.14 shows the first 1.5 ![]() s of
a typical muon precession signal in YBa2Cu3O6.95
displayed in a reference frame rotating at
about 3.3 MHz below the Larmor precession frequency of a free muon.
The curves through the data points are examples of fits
(actually performed over the first 6
s of
a typical muon precession signal in YBa2Cu3O6.95
displayed in a reference frame rotating at
about 3.3 MHz below the Larmor precession frequency of a free muon.
The curves through the data points are examples of fits
(actually performed over the first 6 ![]() s) to
the theoretical polarization function for fixed values of
s) to
the theoretical polarization function for fixed values of ![]() .The only additional constraint in these fits was that
.The only additional constraint in these fits was that
![]() . Differences in the
quality of the fits for the various values
of
. Differences in the
quality of the fits for the various values
of ![]() are most noticeable at early times. This is seen more clearly
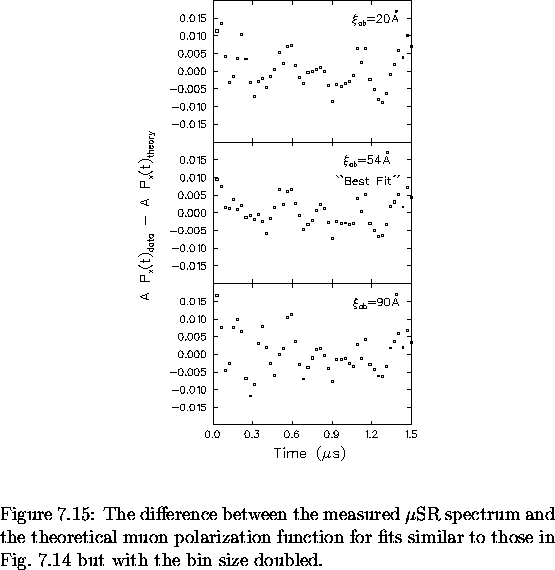
in Fig. 7.15 which shows the difference between the data points
and the fitted curve for fits similar to those in Fig. 7.14.
The ratio of
are most noticeable at early times. This is seen more clearly
in Fig. 7.15 which shows the difference between the data points
and the fitted curve for fits similar to those in Fig. 7.14.
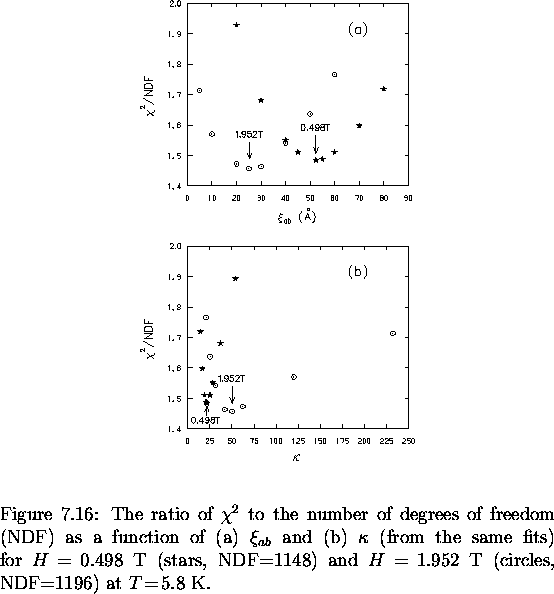
The ratio of ![]() to the number of degrees of freedom (NDF)
is shown in Fig. 7.16(a) as a function of
to the number of degrees of freedom (NDF)
is shown in Fig. 7.16(a) as a function of ![]() for two
of the magnetic fields considered. Figure 7.16(b) shows
the values of the free parameter
for two
of the magnetic fields considered. Figure 7.16(b) shows
the values of the free parameter ![]() obtained from the same fits as in
Fig. 7.16(a). Note that the distribution of data points around
the minimum value of
obtained from the same fits as in
Fig. 7.16(a). Note that the distribution of data points around
the minimum value of ![]() /NDF is asymmetric. Since
/NDF is asymmetric. Since
![]() is essentially unchanged in the fits for different
values of
is essentially unchanged in the fits for different
values of ![]() , this asymmetry
reflects the lack of statistics from the vortex cores in
the measured internal field
distribution. In particular, the fits can tolerate a smaller value
of
, this asymmetry
reflects the lack of statistics from the vortex cores in
the measured internal field
distribution. In particular, the fits can tolerate a smaller value
of ![]() and a longer high-field tail. At the lower field in
Fig. 7.16, the minimum is much sharper because of the
increased size of the vortex cores.
and a longer high-field tail. At the lower field in
Fig. 7.16, the minimum is much sharper because of the
increased size of the vortex cores.
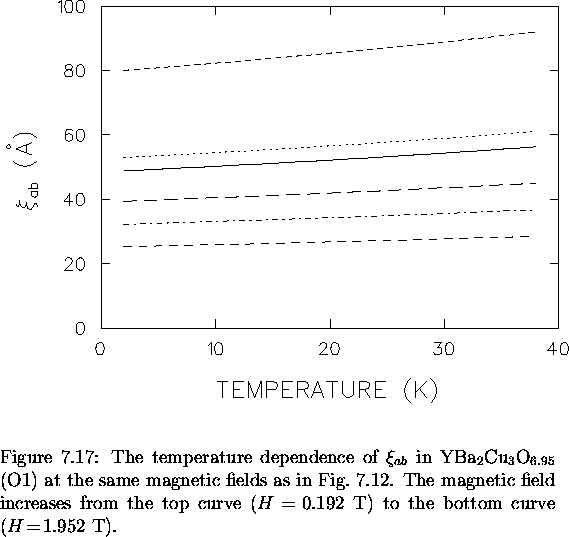
Despite the scatter in the data for ![]() , a smooth plot for
the temperature dependence of
, a smooth plot for
the temperature dependence of ![]() can
be generated from Eq. (7.2) for
can
be generated from Eq. (7.2) for ![]() and
the fitted constant values of
and
the fitted constant values of ![]() . Such plots
are shown in Fig. 7.17 at different magnetic fields where
. Such plots
are shown in Fig. 7.17 at different magnetic fields where
![]() is given by the following relation
is given by the following relation
 |
(6) |
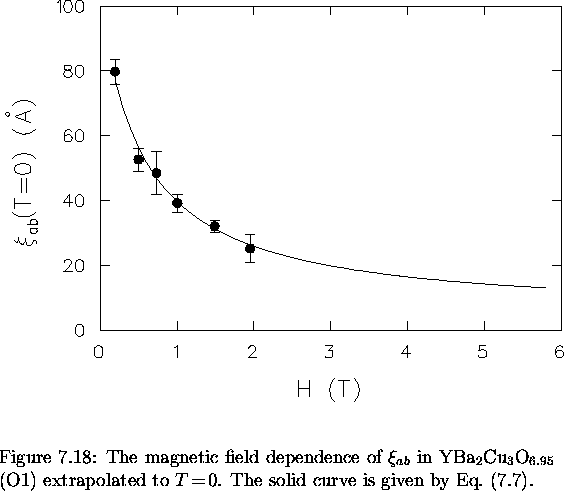
The magnetic field dependence of ![]() extrapolated to
extrapolated to ![]() is shown in Fig 7.18. The solid curve represents the combination of
the fitted relations for
is shown in Fig 7.18. The solid curve represents the combination of
the fitted relations for ![]() and
and ![]() , namely,
Eq. (7.3) and Eq. (7.5). Recall that in the data
analysis assuming the analytical GL model it was found that
, namely,
Eq. (7.3) and Eq. (7.5). Recall that in the data
analysis assuming the analytical GL model it was found that
![]() in Eq. (7.3), so that the relation for
in Eq. (7.3), so that the relation for
![]() at
at ![]() is
is
![\begin{displaymath}
\xi_{ab} (H,0) = \frac{\lambda_{ab} (H,0)}{\kappa (H,0)} = \xi_{ab} (0,0)
\frac{[1 + \beta^\prime h]}{[1 + \eta h ]} \, ,\end{displaymath}](img588.gif) |
(7) |
Our findings are most easily interpreted in terms of
vortex cores which contain discrete quasiparticle bound states.
At ![]() T, which is the field at which the STM
experiment [197] on YBa2Cu3O
T, which is the field at which the STM
experiment [197] on YBa2Cu3O![]() was performed, Eq. (7.7) gives
was performed, Eq. (7.7) gives
![]() Å and with the help of
Eq. (7.6) gives
Å and with the help of
Eq. (7.6) gives ![]() K
K![]() Å.
Using the formula
Å.
Using the formula ![]() [124] and taking
[124] and taking ![]() to be
the BCS coherence length
to be
the BCS coherence length ![]() ,the lowest bound energy level is estimated to be
,the lowest bound energy level is estimated to be
![]() meV.
This estimate agrees well with the STM result of
meV.
This estimate agrees well with the STM result of
![]() meV and the value of 9.5 meV obtained from
an infrared absorption experiment [198] on
YBa2Cu3O
meV and the value of 9.5 meV obtained from
an infrared absorption experiment [198] on
YBa2Cu3O![]() thin films.
The STM measurement implies that
thin films.
The STM measurement implies that ![]() Å at
6 T. The moderate agreement found here strongly supports our assertion
that the coherence length rises appreciably with decreasing magnetic field.
This is one of the most important findings of this study,
because theoretical predictions and the interpretation of experiments
on the high-Tc materials are often based on the assumption
that
Å at
6 T. The moderate agreement found here strongly supports our assertion
that the coherence length rises appreciably with decreasing magnetic field.
This is one of the most important findings of this study,
because theoretical predictions and the interpretation of experiments
on the high-Tc materials are often based on the assumption
that ![]() is extremely small.
The results herein imply that the spacing
between energy levels becomes larger with increasing magnetic field
because of the reduction in
is extremely small.
The results herein imply that the spacing
between energy levels becomes larger with increasing magnetic field
because of the reduction in ![]() --which is analogous to a reduction
in the radius of a cylindrical potential well. In this picture
numerous bound states should exist in the vortex cores of
YBa2Cu3O6.95 at low fields (i.e.
--which is analogous to a reduction
in the radius of a cylindrical potential well. In this picture
numerous bound states should exist in the vortex cores of
YBa2Cu3O6.95 at low fields (i.e. ![]() T).
T).
![\begin{figure}
% latex2html id marker 6758
\begin{center}
\mbox{
\epsfig {file...
...n:linearH})] in
YBa$_2$Cu$_3$O$_{6.95}$\space (O1).\\ \vspace{.2in}}\end{figure}](img562.gif)