We can visualize a vivid example for the sake of illustration:
suppose the "amplitude" ![]() is
the height of the water's surface in the ocean
(measured from
is
the height of the water's surface in the ocean
(measured from ![]() at "sea level")
and
at "sea level")
and ![]() is the distance toward the East, in which direction
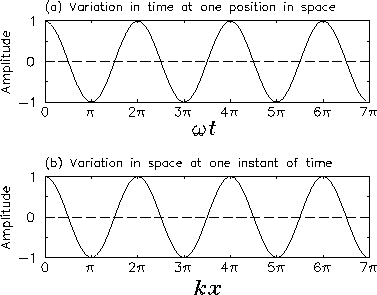
waves are moving across the ocean's surface.14.1Now imagine that we stand on a skinny piling and watch what happens to
the water level on its sides as the wave passes: it goes up and down
at a regular frequency, executing SHM as a function
of time. Next we stand at a big picture window in the port side
of a submarine pointed East, partly submerged so that
the wave is at the same level as the window; we take a flash photograph
of the wave at a given instant and analyze the result:
the wave looks instantaneously just like the graph of SHM
except the horizontal axis is distance instead of time.
These two images are displayed in Fig. 14.1.
is the distance toward the East, in which direction
waves are moving across the ocean's surface.14.1Now imagine that we stand on a skinny piling and watch what happens to
the water level on its sides as the wave passes: it goes up and down
at a regular frequency, executing SHM as a function
of time. Next we stand at a big picture window in the port side
of a submarine pointed East, partly submerged so that
the wave is at the same level as the window; we take a flash photograph
of the wave at a given instant and analyze the result:
the wave looks instantaneously just like the graph of SHM
except the horizontal axis is distance instead of time.
These two images are displayed in Fig. 14.1.